
Engagement
Here, you can view data for User Onboarding Funnel, Registered V/s Transacting Users, Orders per Users, and Daily Active Users.
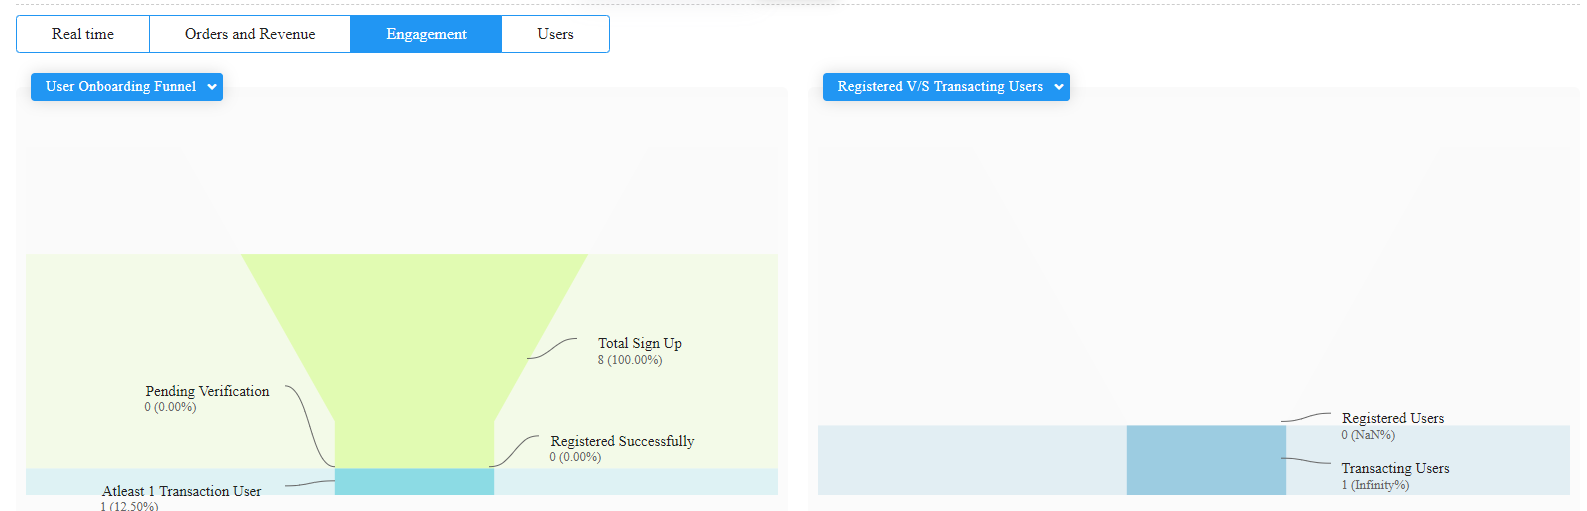
User Onboarding Funnel:
This funnel represents the number of users (both in figures and percentage) for 4 stages. It starts
with the number of users who have registered on the platform, then filters down to those with
pending verification. The last two levels of the funnel present the number of users who are
registered successfully and, lastly, the percent of them who have had at least 1 transaction. This
funnel is a powerful visualizing tool to understand what percent of users filter down to the lower
level, thus displaying the success of the platform.
Registered v/s transacting users:
This funnel shows the number of users who have registered on the platform and the percentage
of registered users who have started transacting.
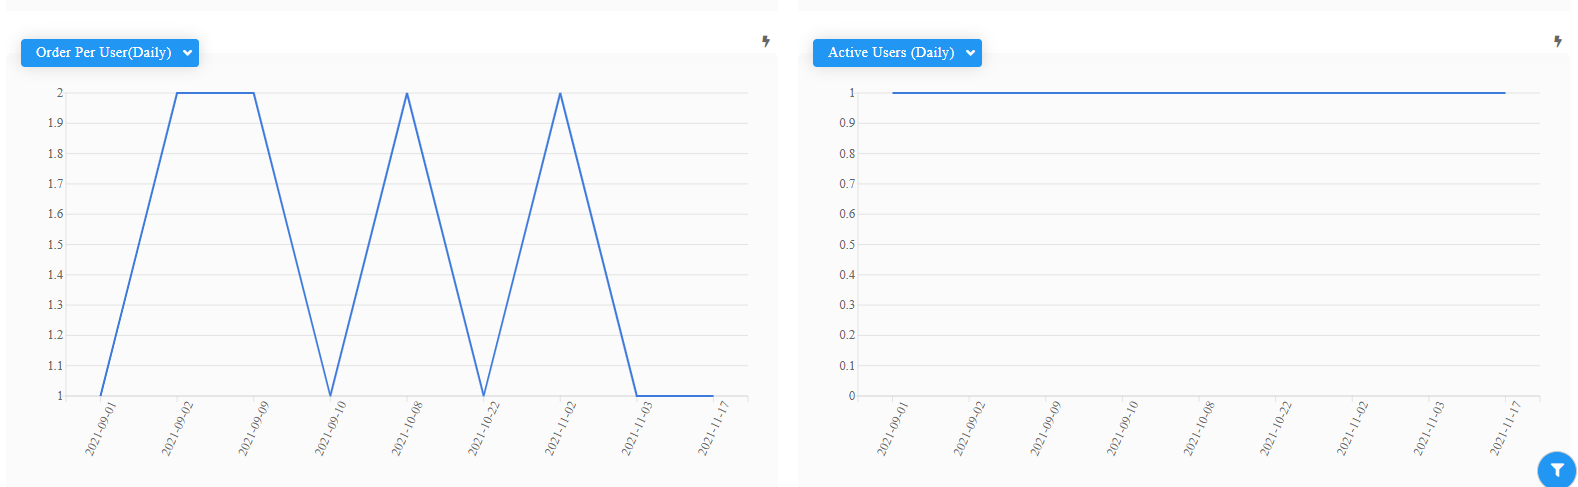
Order per user (daily):
This line graph gives an average number of orders placed by a user on a given date.
Active users (daily):
This line graph gives an average number of active users on a given date.
Leave A Comment?