
Orders And Revenue:
This tab features sections including Order Status, Monthly Revenue and Orders, Product Sales, and Promo Code Used.
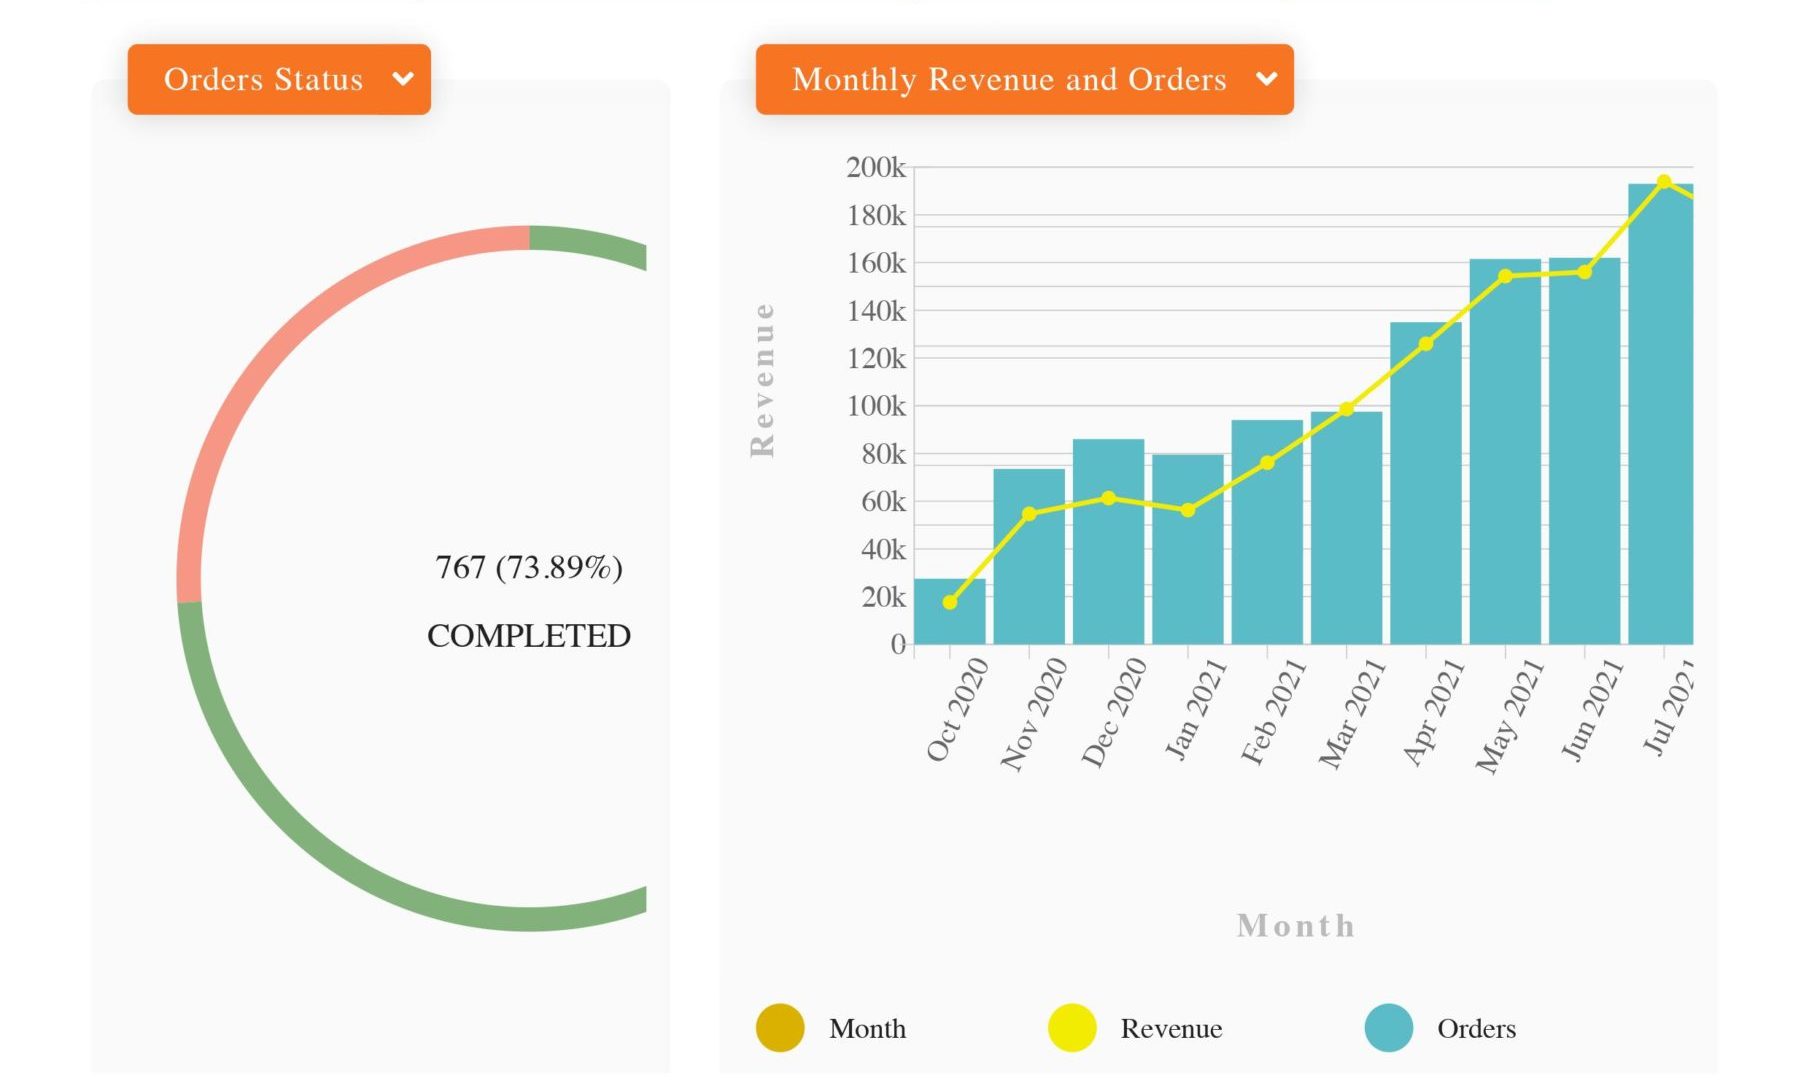
Order status:
Order status gives a quick view of the number and percentage of completed orders in a donut pie
chart. The number and percentage of completed orders are mentioned in the center of the donut
pie chart. The portion in green gives the visual of completed orders and the portion in red gives a
visual of pending orders.
Monthly revenue and orders:
The chart titled Monthly revenue and orders
Represents the number of orders in a given month (given on the Right Y-axis), and the line
the graph represents the revenue generated from those orders on the respective months (given on the Left Y-axis).
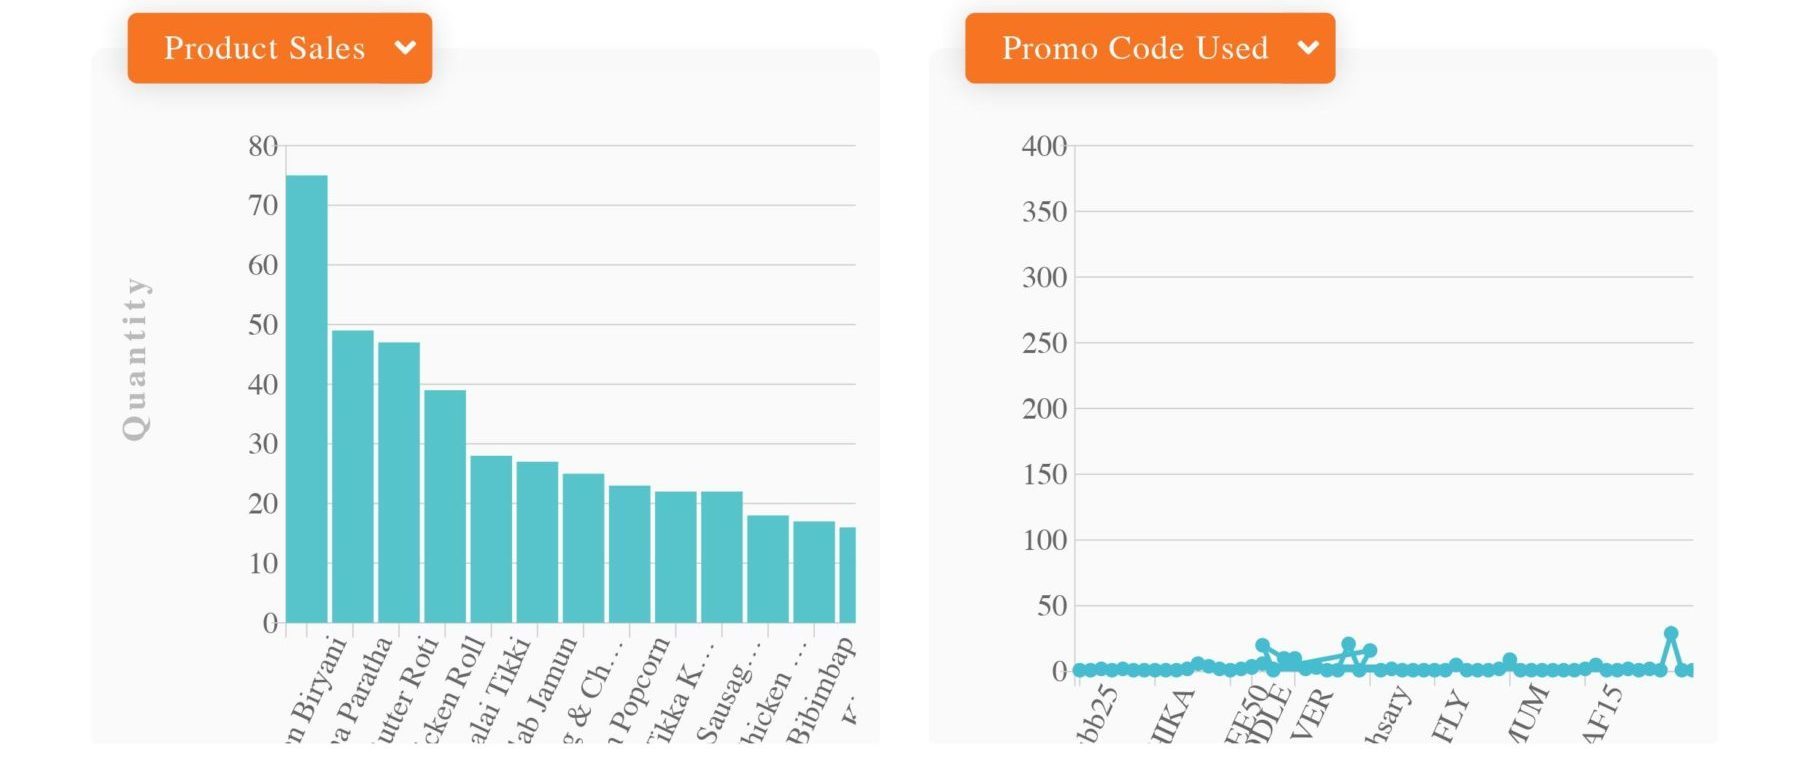
Product Sales:
This chart categorizes the number of products sold by categorizing them into different product
categories represented in a bar graph.
Promo code used:
This chart gives the number of times any particular promo code is used represented by a line
graph.
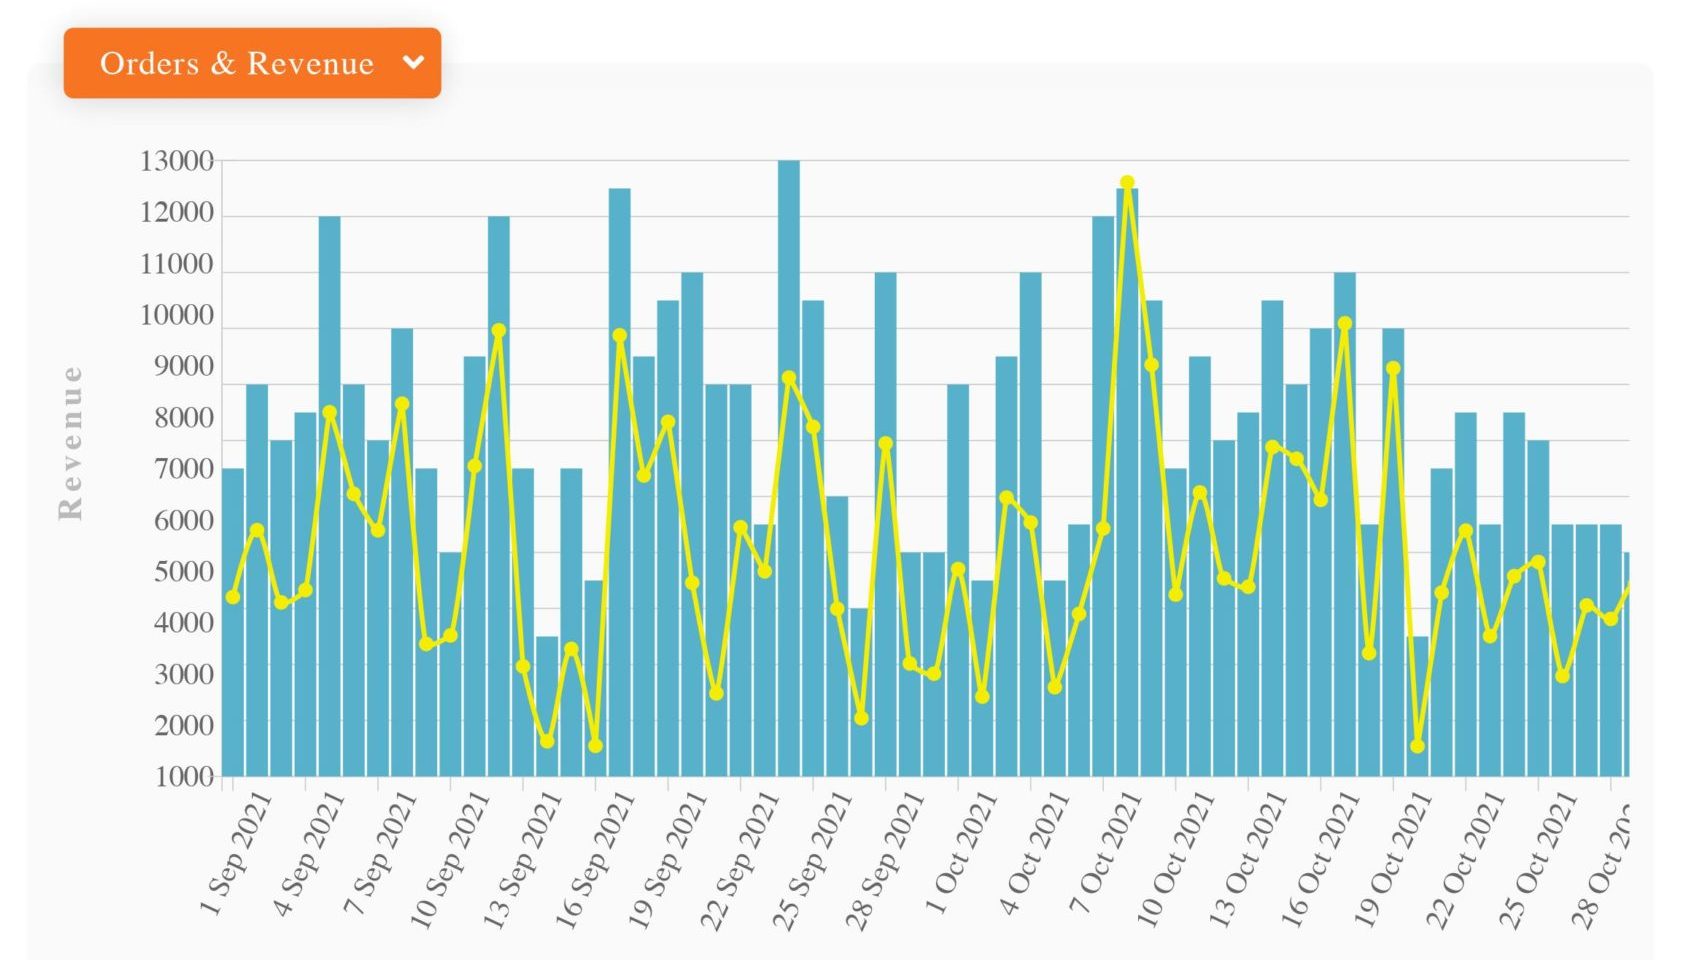
Orders & Revenue:
The chart titled Orders & Revenues
Represents the number of orders on a given day (given on the Right Y-axis), and the line graph
represents the revenue generated from those orders on the respective days (given on the Left Y
axis).
Leave A Comment?