
Custom Analytics Using Kato is another feature of Tookan which allows extracting reports based on various parameters.
Kato is a powerful analytics platform that lets you visualize your data in many different formats. Tookan is integrated with Kato and gives you the ability to see your Tookan data in Kato itself.
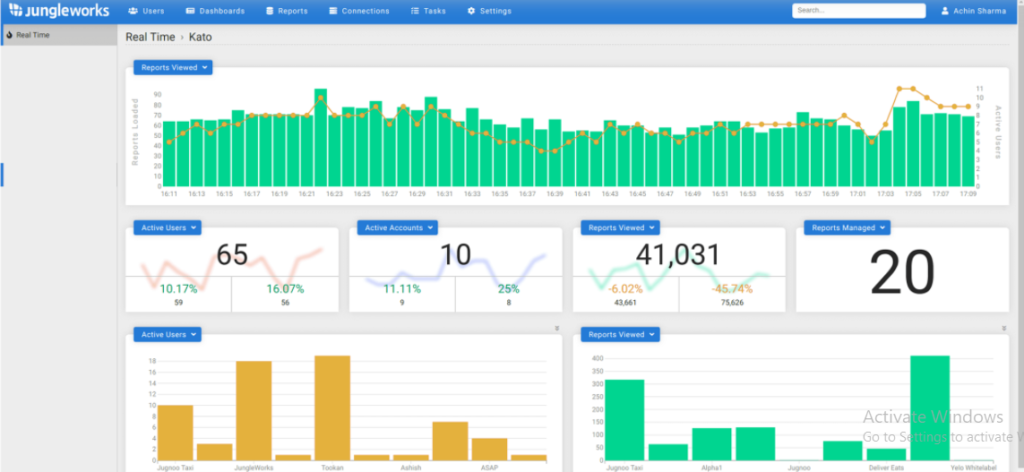
You can request a custom report from our support team and we can set it up for you. A custom report will let you have your own data in a number of different formats like a table, Pie Chart, Line Graph, Bar Chart, Heat Map, etc. A more complete list of available visualizations is provided further down this document.
Following are some advantages of using KATO:
1> Data discovery, planning, and predictive analysis capability
2> Real-time high performance and extensibility using SAP Cloud Platform
3> Provide an engaging user experience across roles and devices
4> Avoid buying and switching across multiple analytics point solutions
To avail this particular Business analytics tool , you can check with your point of contact or Account Manager for further requirments and setup costs.
Once you have a custom report, you can see your report’s data anytime from the analytics panel in your Tookan Dashboard. You can also download/export the data in CSV, JSON or an API call. There’s also the ability to get a report sent to you on your email at regular intervals. The reports are also capable of showing data in real time (though this may vary for different use cases).
Leave A Comment?